Crude Oil
Oil prices posted their first weekly loss in five weeks after settling lower for the second straight session on Friday, as traders fretted over a sharp rebound in U.S. production. Brent futures settled 70 cents lower at $68.61 /bbl while WTI eased 58 cents to $63.37 per barrel.
The narrowing of the Brent-WTI spread arguably reflects the easing of supplies from the Forties pipeline.
For the week, WTI crude fell roughly 1.5%, the largest such loss since early December, while Brent was down about 1.8%, its largest weekly drop since early October.
The IEA said it expects U.S. output levels to soon exceed 10 million barrels per day (bpd), overtaking OPEC behemoth Saudi Arabia and rivaling Russia. The last DOE report had shown domestic production at 9.75 mb/d
The U.S. oil rig count, an indicator of future production, fell by five this week but at 747, was still much higher than the 551 rigs a year ago.
Libya’s National Oil Corporation announced on Sunday the reopening of the eastern As-Sarah oil fields, where more than 50 kbpd in a Wintershall concession had been shut in by a blockade since November
Hedge funds have been increasing long positions steadily on expectations that tightening supply will keep prices buoyant. Money managers raised their net long U.S. crude futures and options positions in New York and London by 40,855 contracts to 541,990 in the week to Jan. 16, a record high. The Intercontinental Exchange said speculators trimmed positions in Brent in the week to Jan. 16 from a record the week before, dropping 3,357 contracts to 570,795.
Overall, however, oil prices remain well supported, and most analysts do not expect steep declines.
Technical Analysis
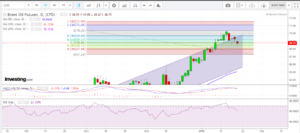
Both daily and weekly charts continue to show highly overbought situations as per the RSI. However, the MACD has crossed over into negative territory in the daily charts signalling caution. Further, the daily chart which had broken out of a rising channel on the upside retreated back inside the channel.
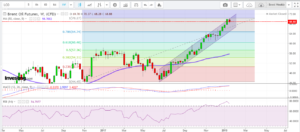
This week we are introducing a technical specialist, Vignesh Iyer for this section. Given below are his views on the Weekly Chart
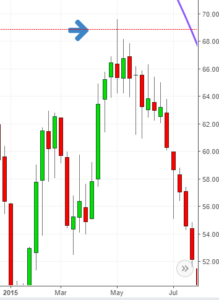
Déjà vu- Prices back at May 2015 long term swing highs.
- The first week-on-week correction after 4 long up-trending weeks.
- The first pause after the technically significant break out from 64.65/b which holds as a 6-week range during early Nov-Dec,2017.
- The week high 70.37/b is notable as the highest since Dec,2014. It also marginally overhauls the May, 2015 swing high of 69.63.
- From a much shorter-perspective the week’s high is almost at the 5 week rally’s price objective of 70.58. So while the larger trends are still strong, the immediate price action is likely to remain subdued till the historical 2-year old supply is absorbed. This is already in play. Ranged action seen over last 8 days is testimony, with the Low of the range – 68.28 – made on Friday.
- This pause allows near-term averages to catch up so current lows can hold. But fresh upside action beyond the weekly high is likely top take another week, if not more. (remember the last 3 consolidations take 4,5 and 8 weeks before propelling fresh rallies)
- The next important technical event of the current 7-month rally, is its price objective at 72.75.
- Traders can continue to remain bullish with a -buy-declines- approach till 72+, after which risk needs more aggressive managing.
- In the coming week- Supports in the 68-68.30 range should hold declines provided Brent continues in a flat corrective mode. A change in trend character is indicate below 67.18. This level defines the outer bounds of acceptable risk.
Last week, we had recommended selling the commodity near $ 70 / bbl. We will close the position today in the light of the recommendation from Vignesh and book profit.
Naphtha
The Asian physical naphtha crack continued its recovery, settling at $ 94.57 /MT on Friday supported by demand. However, cash premiums continued to drop. Deals for C&F Korea were reported at premiums of $ 6.5 – 7.0 /MT to Japan quotes, the lowest levels since October.
The February naphtha crack is valued at $ 1.00 /bbl today.
Gasoline
The Asian physical gasoline crack rose $ 8.01 /bbl. While gasoline stocks have risen in the US, they have drawn in ARA, Fujairah as well as Singapore in the last week.
The February crack is however valued lower at $ 11.75 /bbl.
Distillates
10 ppm gasoil premiums held steady at more than 30 cents / bbl to Singapore quotes. However 500 ppm gasoil was quoting at discounts largely due to ample supplies. Gasoil stocks in ARA, Fujairah and Singapore have all increased last week.
The February gasoil crack is unchanged at $ 14.65 /bbl with the 10 ppm crack also staying at $ 15.70 /bbl. The February regrade has improved to $ 0.55 /bbl.
Fuel Oil
Asia’s fuel oil time spreads and cracks traded higher for a second straight session on Friday, shedding losses from earlier in the week amid improving market sentiment. This came despite increased fuel oil loadings in northwest Europe destined for delivery into Singapore around end-February.
Fuel oil stocks in the Amsterdam-Rotterdam-Antwerp (ARA) oil hub dropped 219,000 tonnes, from the previous week to a more-than-five-month low of 0.816 million tonnes in the week ended Jan. 18.ARA fuel oil inventories were 16 percent higher than a year ago, but were below the five-year average of 926,000 tonnes for this time of the year. The fuel oil drop was due to two VLCCs that left the region for Asia.
The February 180 cst crack has improved to -$ 4.95 /bbl. The visco spread has also increased to $ 0.80 / bbl.
About this blog
This blog post attempts to give a top level summary of the Singapore market goings on to a person who seeks to obtain a directional sense of the market on a daily basis.
Disclaimer : All the views are the author’s personal views. These do not constitute an advice to buy or sell any commodity