Crude Oil
Oil prices on Friday continued to settle higher for the fifth session in a row and in the process registered its biggest weekly gain this year. While Brent rose by $1.03 or 2%, to settle at $52.52 /bbl after touching a two-month peak of $52.70 /bbl, WTI increased by 67 cents, or around 1.4%, to end at $49.71 /bbl after touching $49.81 /bbl, its highest level since May 30 earlier this year.
With the recent announcements by Saudi and Nigeria, there appears to be greater confidence among market participants that rising demand will offset excess supplies in the second half of the year.
Technical Analysis
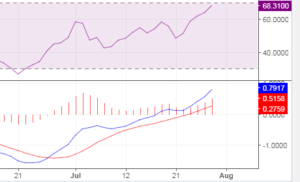
Technically, the Brent charts are looking very positive with most of the technical indicators also pointing towards a further rise in prices.
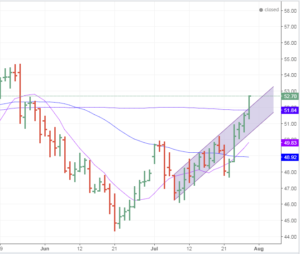
The daily charts show that Brent not only broke through the ascending channel (which was earlier temporarily breached for a few days) but also rose and closed above the 200 day moving average. Additionally, if one was to look at the shorter term moving averages, the 10 day moving average crossed the 50 day moving average on 25.07.2017 earlier this week, signalling an upmove.
Whilst most of the technical indicators like the RSI and MACD are showing a buy signal, some indicators like the CCI are showing Overbought conditions. Overall, the market from a technical analysis point of view is looking bullish.
The resistance levels are $53.06 followed by $54.00 and then $54.60. On the other hand, key supports are $51.85 and $ 51.20.
Naphtha
The Naphtha crack stays supported as spot demand emerged from South Korea, Japan, Malaysia and Taiwan. This was also reflected in the premiums being realized by sellers for spot cargoes. India’s IOC for example, was learnt to have sold 35,000 tonnes of naphtha for Aug 22-24 loading from Chennai at a premium of about $8/mt to its own price formula on an FOB basis as compared to a premium of $5/mt it got for a cargo loading Aug 1-3 loading from the same port.
The August crack is unchanged at $0.85/bbl.
Gasoline
Gasoline crack has strengthened even as stocks held independently at the storage at the Amsterdam-Rotterdam-Antwerp (ARA) hub was at a five-week high of 864,000 mt in the week to Thursday. What is relevant to note is that despite this increase, gasoline stocks were more than 30 percent lower than a year ago.
The August crack is valued at $ 12.00 /bbl. today.
Distillates
Gasoil cracks have also risen as positive reports of growth in diesel demand in China, the world’s No.2 economy began surfacing. Diesel demand in China is expected to grow by up to 0.3 % in 2017 and by 0.5 % in 2018 after shrinking by 3.5 % last year.
The August gasoil crack is stronger at $ 14.60 /bbl. The regrade for August is unchanged at -$0.90 / bbl.
Fuel Oil
Fuel Oil cracks have eased on the back of high inventories across key trading hubs and plenty of cargoes being offered by various sellers in the spot market. Recently, India’s IOC was heard to have offered 35,000 tonnes of 380-cst for Aug. 24-26 loading from Chennai.
The 180 cst August crack is lower at -$1.85 / bbl. The visco spread is at $0.80 /bbl.
About this blog
This blog post attempts to give a top level summary of the Singapore market goings on to a person who seeks to obtain a directional sense of the market on a daily basis.
Disclaimer : All the views are the author’s personal views. These do not constitute an advice to buy or sell any commodity