At first, we would like to sincerely apologize for our inability to publish the Oil Price Digest on Friday. There were truly exceptional circumstances which caused this situation.
Crude Oil
Crude Oil finished up, indeed spectacularly up for the third day in a row taking prices to levels not seen in a long time. Brent closed $1.14 cents higher at $60.44/bbl while WTI added $ 1.26 to settle at $ 53.90 /bbl.
Yesterday’s prices are multi month highs for both markers. While this is the highest price attained by WTI in the last 8 months, Brent has not been seen above $ 60/bbl since June 2015. Both markers gained around 4.7% in the last week. If we consider that prices actually fell on Monday, the rise in the remaining four days has been nothing short of spectacular!
What has contributed to the rise? We are seeing commentaries all around us talking about ‘extension of oil cuts beyond March 2018’, geopolitical tensions, increase in demand etc. Call us contrarian if you will, but we do not see this news as anything new which should have precipitated the jump in the last two days of the week. Fundamentally, therefore, we see prices return to the $50-55 range soon. We may be proved wrong, but at this stage, we are willing to stick our neck out on this prediction and recommend selling Brent Jan / Feb / March futures above $ 60 /bbl. The current front month December future expires tomorrow and therefore may not have enough time to play out this position.
Over the weekend we have been seeing news which is tentatively bearish but may not have much impact on the prevailing sentiment in the market. There have been reports of a cease fire between the Iraqi forces and the Peshmerga in the northern Kurdish region. Also, the number of rigs in service increased by 1 to 737
Technical Analysis

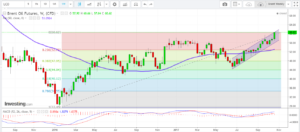
Both Daily and Weekly Charts show a strong bullish trend firmly in place. In the daily charts, the MACD has literally criss crossed in the last week, first flipping into negative territory but immediately turning back and strongly at that to go high on the positive side. Having said that, there is a bearish divergence if we look at MACD levels at the previous high attained just a month ago. Given that the bearish divergence is visible in the weekly chart as well, it gives a faint warning tinkle. We can also see that prices are at the top of the rising channel in the weekly charts so that level should act as a resistance.
Supports would lie at $ 60.00 (psychological), then $ 59.37 and $ 58.41, both Fibonacci Levels. The first resistance would be at around $ 61.00 along the rising weekly channel and then $ 61.97 and $ 62.85 which are Fibonacci extensions
Naphtha
The physical naphtha market continues to stay strong on the back of consistent spot demand. Also adding to the bullishness is a reduction in naphtha inventories in the Amsterdam-Rotterdam-Antwerp (ARA) storage and refining hub which as per last week’s numbers, fell to nearly a nine months low.
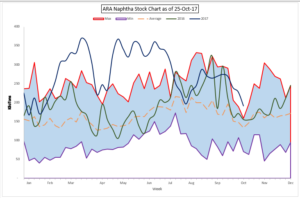
While the stocks are still at their highest for this time of the year, if we don’t see good builds in the forthcoming weeks, they may well soon drop below the 5 year average.
The paper crack for November is lower at $ 3.60 /bbl. High crude prices could be arguably putting pressure on the crack
Gasoline
The Gasoline cracks have also found support by way of falling inventories held independently in tanks in the ARA hub. Stocks fell to almost a year low of 769 KT in the week to Thursday 26th Oct 2017. This coupled with strong draws in both the US and Singapore makes for some interesting speculation.
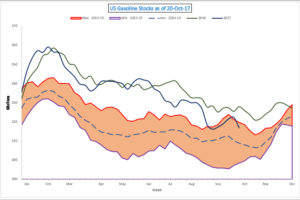
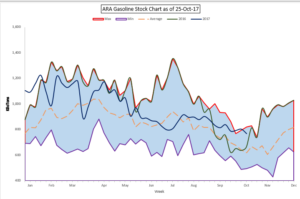
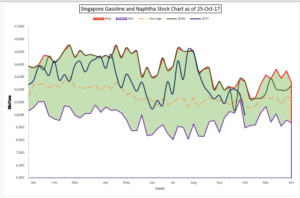
While all three regions experienced significant drops, it is noteworthy that, except for Singapore, the stock levels in the other regions are pretty high. With the driving season coming to an end in the US, we do not expect cracks to jump anytime soon unless we get a warmer winter.
The November 92 Ron paper crack is lower at $ 11.15 /bbl.
Distillates
Distillate cracks have receded further as unexpected cargoes continue to be offered out of India. Typically, Indian refiners stop offering diesel for exports once the monsoon season is over as domestic demand picks up smartly thereafter. However, this year several refineries continue to float tenders well past the end of the monsoon season. This is likely prompted by recently completed upgrades at various refineries to meet changes in sulphur standards for domestic fuel.
The November gasoil crack is marginally lower at $ 12.95 /bbl today. The regrade however is unchanged at $ 0.10 /bbl.
Fuel Oil
Fuel Oil cracks have fallen as inventories continue to build across key trading hubs amid muted demand and surplus supplies.
Fuel oil stocks in the ARA hub rose 6 % in the week to October 26. Compared to last year, ARA fuel oil inventories are up 122 % and are well above the five-year average of 793,000 MT for this time of year. Similarly, fuel oil inventories in Singapore rose 3 % to a total of 3.75 million MT in the week to October 25 while inventories in the Fujairah Oil Industry Zone (FOIZ) were 6 % higher in the week to October 23 to a total of 1.38 million MT.
The November 180 cst crack is valued significantly lower at -$2.75 / bbl. The visco spread is unchanged at $ 0.75 /bbl.
About this blog
This blog post attempts to give a top level summary of the Singapore market goings on to a person who seeks to obtain a directional sense of the market on a daily basis.
Disclaimer : All the views are the author’s personal views. These do not constitute an advice to buy or sell any commodity
