Crude Oil
Oil prices ended the week mildly lower and traders appeared to not want to carry their trades over the weekend. Brent crude futures fell 24 cents to settle at $73.21 a barrel. U.S. West Texas Intermediate (WTI) crude futures also fell 47 cents to settle at $68.49 a barrel..
WTI posted its 5th straight weekly loss while Brent has had 4 losses in 5 weeks.
For now the markets are focusing on a slew of bearish factors that are emerging.
For one, there is absolute evidence of an increase in production with fears of it leading to oversupply. Russian oil output rose by 150,000 barrels per day (bpd) in July from a month earlier, to 11.21 million bpd. Output by top exporter Saudi Arabia has also risen recently, to around 11 million bpd, and U.S. production is around that level as well, adding to indications of more ample supply.
For another, the trade war between the US and China seems to be escalating with China raising tariffs on $ 60 billion of US imports. Sinopec has suspended purchase of US crudes and says it has plans to impose tariffs on LNG raising concerns it could also impose tariffs on oil.
Saudi Arabia is said to resume shipments from Bab Al-Mandab on August 4, according to a ministry statement issued earlier on the day itself. Shipments were halted on July 25 after two crude tankers were attacked.
There also appear to be strong signs now that Iran supply may not be affected as badly as previously feared.
China has rejected a U.S. request to cut imports from Iran. India’s monthly oil imports from Iran also surged by about 30 percent to a record 768,000 barrels per day (bpd) in July, as state refiners’ intake surged ahead of U.S. sanctions in November.
U.S. drillers cut rigs for the second week in three, reducing the number of oil rigs by two to 859.
The speculator group cut its combined futures and options position in New York and London by 5,287 contracts to 407,001 during the week ending July 31.
![]()
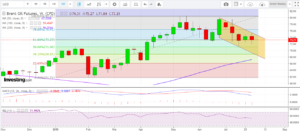
Prices continued their downward move for the fourth week in five as can be evidenced from the weekly chart.
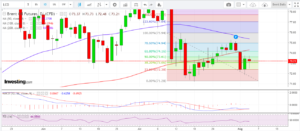
The small body of Friday’s candle on the daily chart reflects the uncertainty that appears to be getting greater in the markets. Another key factor in last week’s price action was the dramatic fall of prices below the 100 DMA notwithstanding the change of front month at a contango.
The MACD in the daily charts seems to be on the point of switching back into negative numbers. While the MACD in the weekly charts has been negative for a long time now and increasing, the RSI seems to indicate there there is possibly still some room to move downwards. The RSI in the monthly charts also looks overbought suggesting room to move lower rather than higher.
Trading Strategy
Last week we had recommened that traders with length should exit should prices fall below the 100 DMA. Such traders would have been stopped out. We had also suggested for traders with a bearish bias that they go short on Monday. These positions are now strongly in the money. We would recommend running these and adding below $ 71 with a target of $ 69.00 /bbl. The primary stop loss would be the 100 DMA (currently at $ 74.35). If $ 71 is breached, then the stop loss may be moved appropriately lower.
Supports and Resistances
The $ 72.90 – 73.25 range is the first basic support. Further below, supports lie in the $ 72.50 area and then in the $ 71.60-75 area. There is a very strong support below that in the $ 71.00-30 are which, if broken, could lead to a further fall.
The first resistance lies in the $73.75-80 area. The next resistance, which we believe will be strong, is in the $ 74.25-50 area. Above that we see a resistance in the $ 75.25 area.
For larger charts, daily, weekly, or monthly, please check our Technical Views page.
Naphtha
Asia’s naphtha physical crack hit a 1-1/2 week low on Friday on higher crude oil price and muted demand .
The balance August crack is lower $ 0.60 /bbl.
Gasoline
Asia’s gasoline crack eased 3 percent to reach a two-session low of $7.46 a barrel as stocks were ample in Singapore and Europe, with the exception of the United States.
ARA Gasoline stocks were at a two-week high of 974,000 tonnes in the week to Thursday. This was also higher than stocks from a year ago at 916,000 tonnes..
The balance August crack is higher at $ 8.85 / bbl.
Click Here for a graphical depiction of Global Gasoline stocks by region.
Distillates
Asia’s cash premiums and refining margins for 10ppm gasoil strengthened on Friday after a weekly draw in Singapore middle distillate stocks helped firm market fundamentals.
Cash premiums for gasoil with 10 ppm sulphur content were at 10 cents a barrel to Singapore quotes, the highest in 1-1/2 months. The premiums were at 8 cents a barrel on Thursday.
Cash premiums for jet fuel were at 10 cents a barrel to Singapore quotes, compared with 12 cents a barrel on Thursday.
Gasoil stocks in the ARA region rose by 3.9 percent in the week to Thursday. Due to slow inland demand gasoil inventories for the week to Aug. 2 rose to 2.49 million tonnes, levels not seen since April this year. Jet fuel inventories climbed 3 percent to 692,000 tonnes. Compared with year-ago levels, gasoil inventories were 8.4 percent lower, while jet fuel stocks were up about 23 percent.
The balance August crack has improved to $ 13.80 / bbl with the 10 ppm crack at $ 14.70 /bbl. The regrade has eased to $ 0.65 /bbl.
Click Here for a graphical depiction of Global Distillate stocks by region.
Fuel Oil
Cash premiums for cargoes of Asia’s 380-cst fuel oil extended losses on Friday amid weaker deal values in the Singapore trading window.
Despite the lower deal values, however, there were few signs of easy supply constraints over the near term as availabilities of finished grade fuel oil are expected to remain constricted through August and into September.
ARA weekly onshore fuel oil inventories fell by 137,000 tonnes to an eight-week low of 1.191 million tonnes in the week ended Aug 2. Stocks fell after a very large crude carrier (VLCC) departed to the far east and a smaller tanker left for the Mideast Gulf. ARA fuel oil exports in the week to July 26 originated from the Black Sea, Finland, France, the Mediterranean, Poland and Russia. Compared with last year, ARA fuel oil inventories were 20 percent higher and above the five-year average of 910,000 tonnes for this time of the year.
The balance August 180 cst crack is weaker at -$ 0.75 / bbl with the visco spread at $ 1.10 /bbl.
Click Here for a graphical depiction of Fuel Oil stocks by region.
Hedge Recommendations
Nothing fresh to report today.
Hedge recommendations are essentially made for refiners. These are not trading positions as such. The rationale of these positions is to lock in extraordinary levels for the refiner.
Click Here to see how all our recommendations have fared
About this blog
This blog post attempts to give a top level summary of the Singapore market goings on to a person who seeks to obtain a directional sense of the market on a daily basis.